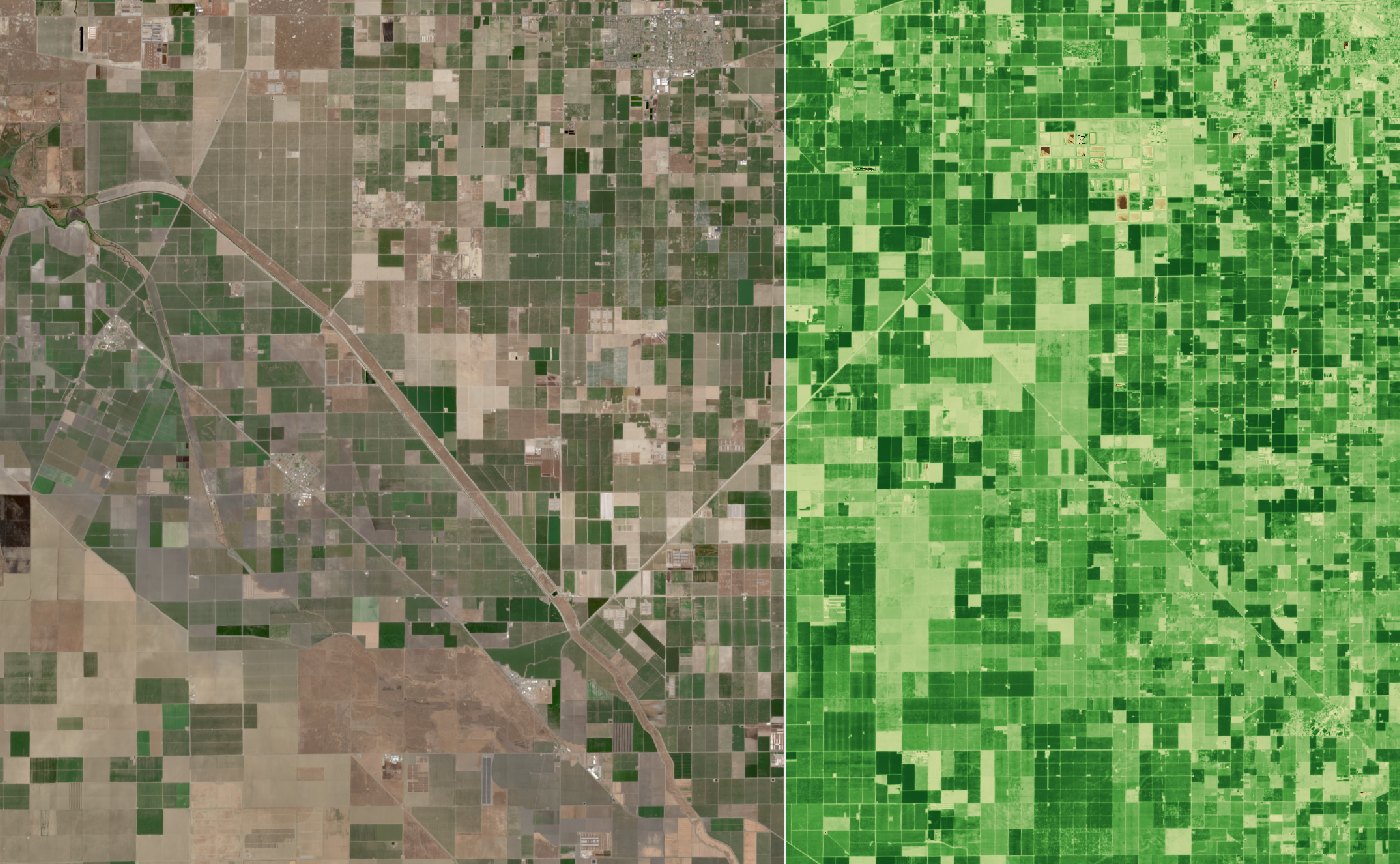
A TerraScope frame of California's Central Valley: natural colour on the left, plant health (NDVI) on the right
Real TerraScope frame · Sentinel-2 L2A · 2026-07-09 · natural colour | NDVI · two granules stitched
Project 8 · Open source · 2026

TerraScope

A browser app that turns raw Sentinel-2 satellite measurements into a timelapse you can play: search a place, press Play, and watch the ground change, in natural colour or as plant health, with cloudy days removed automatically.

React · TypeScriptWebGPU · WGSLFastAPIGDAL · rasterioSTAC · COGDocker · Cloudflare
2–7 scold frame (was 39–49 s)
0.01 scached frame
7.4 ssix-month date search
202tests (118 web · 84 Python)
What I built

Features

01Explore map

Sentinel-2 cloudless basemap with labels, free pan and zoom up to 14, where one screen pixel ≈ one 10 m satellite pixel.

02Place search

Suggestions as you type (Photon, OpenStreetMap). Enter zooms to fit the place.

03One-button timelapse

Play finds every date for the view, locks it, and loads one processed frame per date.

04Science frames

Calibrated reflectance and masks, sent as numbers. The GPU colours them: natural, false colour, NDVI.

05Granule mosaic

Views where granules meet are stitched from the same satellite pass, pixel by pixel.

06Cloud removal

Each frame's own cloud mask measures the view. Frames over 30% cloudy are removed; one click restores.

07Player

Play, scrub, speed, loop, keyboard. Click any date segment to remove it.

08Long ranges

Years of dates searched month by month in parallel, thinned to 60 frames, clearest per time slot.

09Visible progress

Bars for frames loaded and for live requests: server time, then bytes.

Architecture

The browser shows numbers; a service next to the data makes them

BROWSEREDGESERVICEDATA DOM basemapexplore · EOX tiles MapScene · WebGPUnumbers → colour frames on GPU React sidebardates · layers · clouds Vite proxy (dev) · Cloudflare Workerserves the app · routes /raster/api/* R2 tile cache scene ID + view FastAPI raster servicescene ID in · never a URL frame buildercalibrate · masks · mosaic disk frame cache 5 band files readin parallel Earth Search STACsearch · outlines · cloud % Sentinel-2 COGs · AWS S3range reads · 5 files / date HTTPS range · ≈0.9 s each
The service is the trust boundary: it accepts a scene ID, checks every file host against an allowlist, and applies calibration exactly once. Frames travel as numbers in my EOT1 binary format, so the GPU can switch layers without asking the server again.
Architecture decisions

What I chose, and what I didn't

DecisionRejectedWhy
Server reads COGs with GDALReading COGs in the browserOne trusted place for hosts, reprojection, calibration and masks; results cached for everyone
Send reflectance numbersSend coloured PNGsInstant layer switching, real pixel values, and cloud % measured in the view
One frame per date~20 map tiles per dateOne read per band per date instead of twenty; easy to cache and replay
Stitch same-pass granulesUse only the centre granuleViews where granules meet were mostly empty; same pass = same moment, so it's honest
Judge coverage by real outlineScene bounding boxAt a swath edge, data fills only a diagonal slice of the box
Cloud % from the frame's maskCatalog cloud %Catalog covers a 110 km granule: 31% said, 47.5% in the view
Search month by month, in parallelOne long paged listThe long list silently cut off the newest months
DOM basemapDraw basemap on the GPUIt's just pictures; works even when WebGPU doesn't
Feature · measuring before fixing

Why the first image was slow: round trips, not code

one after another · 9.1 sdashed = open (header) · solid = read catalogredgreenbluenirSCL 9.1 s in parallel · 4.2 s catalogredgreenbluenirSCL 4.2 s = slowest file 40 px = 1 s · one cold tile inside each file: built-in copies 10 m · 10980 px 20 m · 5490 px 40 m · 2745 px 80 m · 1373 px 160 m · 686 px the smallest copy is still 686 px: ≈ 1.2 MB per band, 5–6 MB per image and every request from here ≈ 0.9 s fewer pixels on screen ≠ fewer bytes
Measured on one cold z6 tile. The parallel line is the slowest file; real runs swung from 3 to 16 s with the link speed. That told me the fix was architectural: read less per date, cache what was read, and ultimately run next to the data.
Feature · one complete frame per date

Stitch the same pass, and skip what the satellite didn't see

mosaic · same pass, same moment locked view granule A · lead granule B · fills gaps filled from B whole pixels:bands + masks coverage from the real outline swath edge bbox says 100% · outline says 53% under 80% → skip this date 16 × 10 samplesin the app test view (4 granules, 2 orbit tracks): 16 full dates kept · 27 half-imaged skipped
The builder reads the lead granule first and touches the others only if pixels are still empty, so a view inside one granule costs nothing extra. Each pixel keeps its own calibration and masks, and the frame header lists every granule used.
Feature · clearest dates first

Pick by time slot, then check each frame's own clouds

1 · before download: even slots, clearest date wins bar = catalog cloud % (whole 110 km granule) · schematic 60 slots in the app 2 · after load: cloud in the view, from the frame's mask 04-02 · 85%removed 04-07 · 97%removed 04-12 · 1%kept 04-17 · 62%removed 07-01 · 4%kept 09-29 · 13%kept rule:> 30%
The catalog number ranks dates cheaply before anything downloads; the frame's own mask (SCL cloud, shadow and cirrus) decides after. One date the catalog called 59% was 85% cloudy in the view. Removed frames stay one click from coming back, and the user's choice always wins.
Memory & buffer layout

One frame: 26 bytes per pixel, numbers not colours

per pixel · 26 B30 px = 1 B red f32 green f32 blue f32 nir f32 coverage ×4 analysis ×4 qualityclear reflectance · 16 Bmasks, 1 = valid · 10 B on the wire · EOT1, planar header red 1.19 MB green blue nir 10 mask planes · 0.30 MB each header: magic · length · JSON (grid, calibration per band, source granules, policies) 620 × 480 = 297,600 px × 26 B= 7.74 MB (measured) · cap 8 MiB budget 300k px per frame · never finer than 10 m rgba32float texel · 16 B on the GPU · ~40 B / px + NDVI and validity planes → ≈ 12 MB per frame
Planar layout means each band is one contiguous array the browser can view without copying. Two kinds of mask on purpose: coverage drives drawing, analysis drives NDVI, so display and science never silently change each other. The clear mask (not cloud, shadow or cirrus) is what measures clouds per view.
Results & what's next

Every fix started with a measurement

7×

Cold frame

39–49 s → 2.2–7.0 s: one read per date, bands in parallel, the right overview level.

2.3×

Fewer bytes

2.8 → 1.2 MB per band on wide views by allowing a copy up to 2× coarser.

1.7 s

Replay

17-date timelapse from the disk cache; 97 s the first time.

7.4 s

Six months, complete

Was 25 s and cut off at 3 June; now month by month, in parallel.

85%

Clouds measured, not guessed

The catalog said 59%; the view's own mask said 85%, so it's removed.

≥80%

Of the view in every frame

Granule mosaic plus outline-based coverage: half-imaged dates are skipped.

Next: run the service in AWS Oregon next to the data (most of today's wait is network), show the 41 KB scene thumbnail while the first frame loads, refill cloudy time slots with the next clearest date, catalogue scenes in PostGIS, and switch frames to 16-bit reflectance to halve their size.